
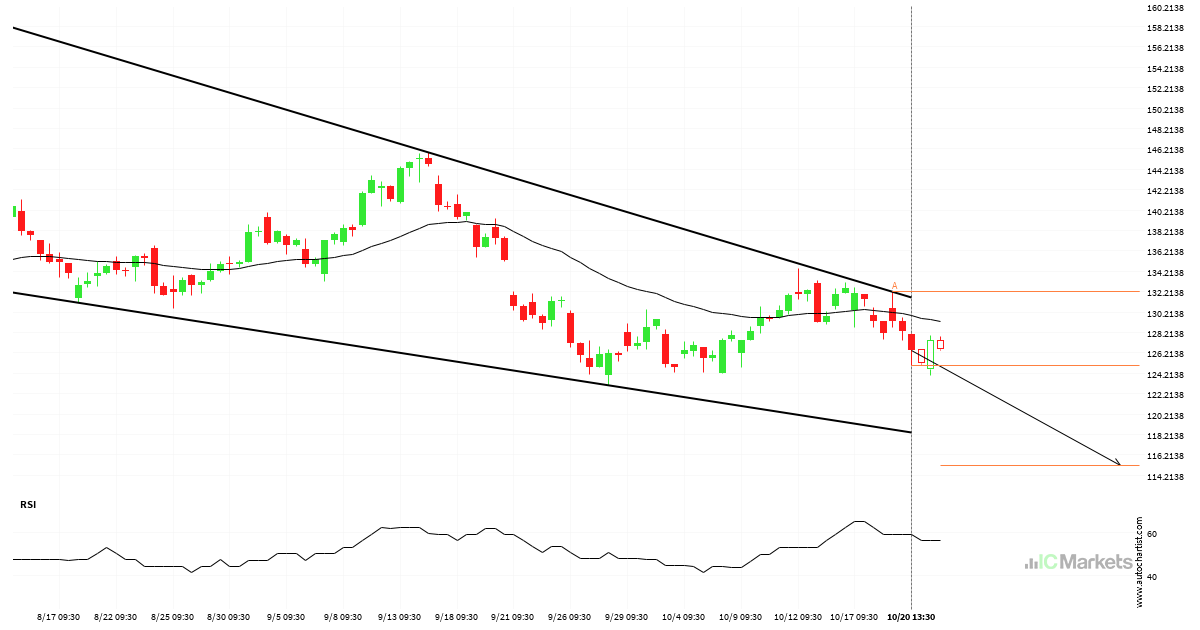
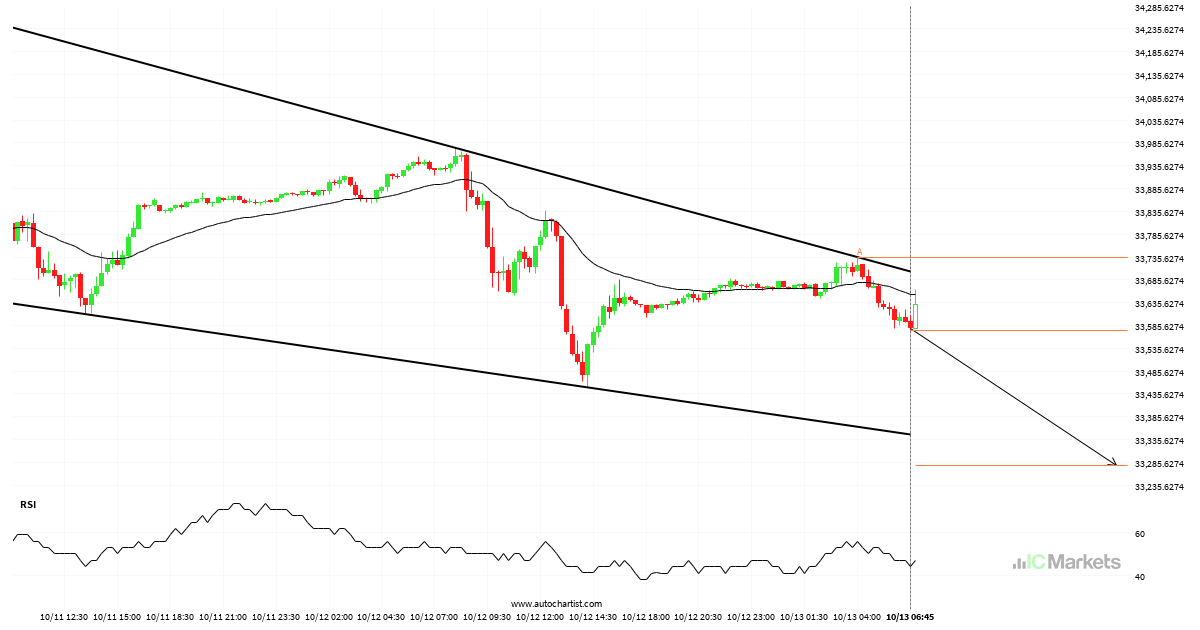
Amazon.Com Inc. approaching support of a Cunha descendente
Amazon.Com Inc. is approaching the support line of a Cunha descendente. It has touched this line numerous times in the last 78 days. If it tests this line again, it should do so in the next 2 days.
What’s going on with US Small Cap 2000 Index?
Those of you that are trend followers are probably eagerly watching US Small Cap 2000 Index to see if its latest 1,01% move continues. If not, the mean-reversion people out there will be delighted with this exceptionally large 9 hours move.

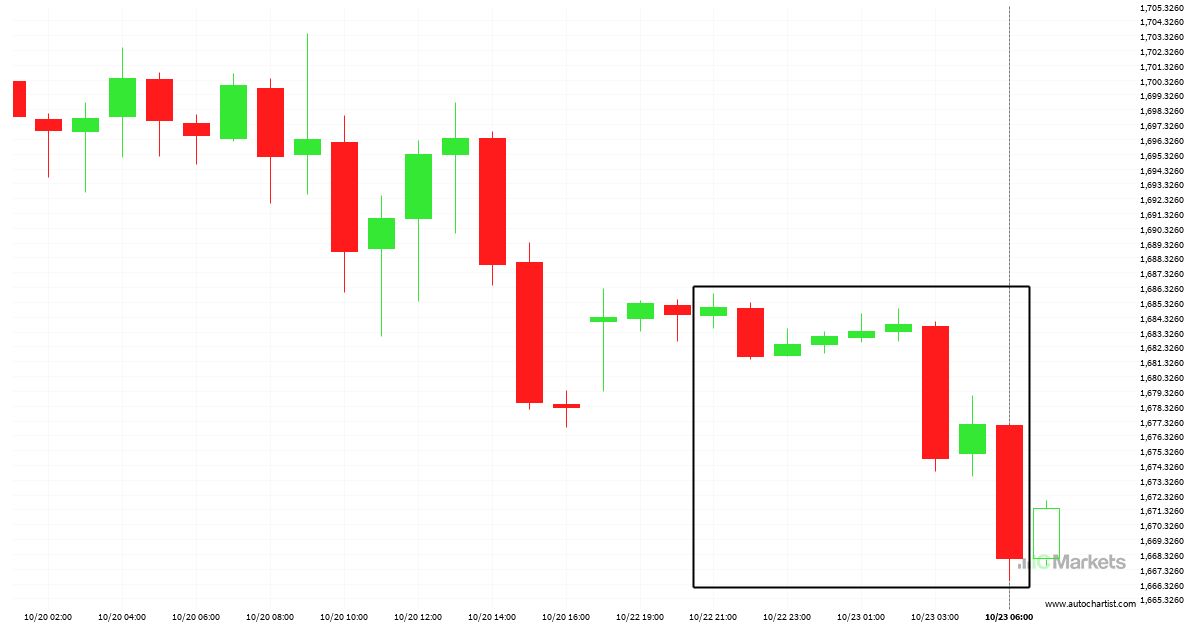
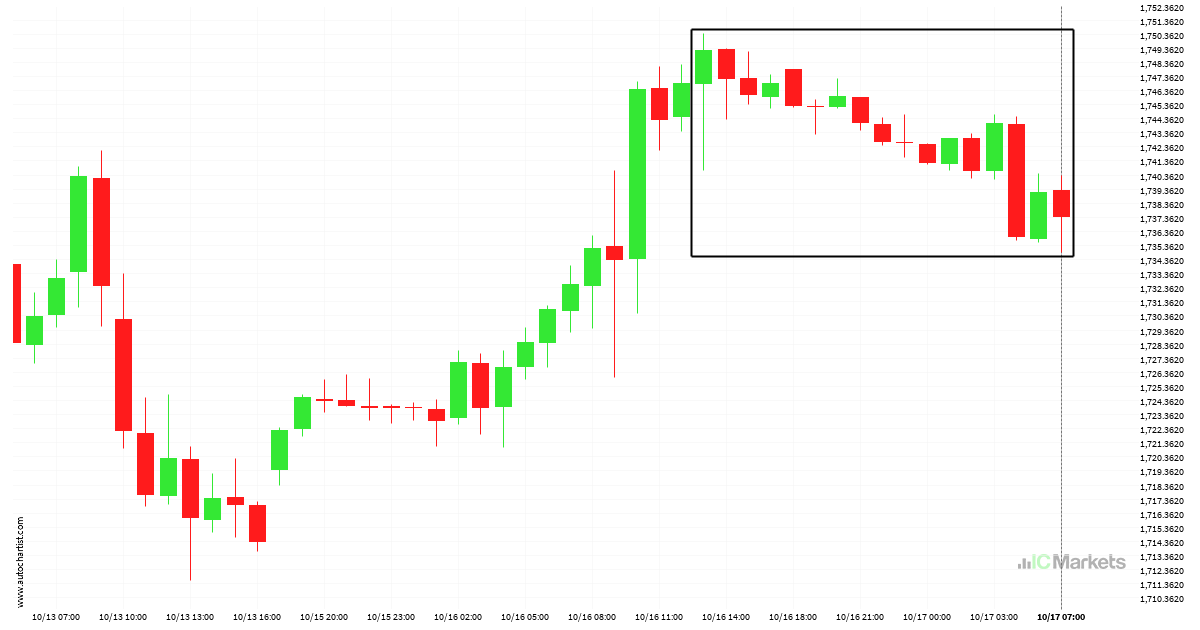
Possible breach of support level by US Wall Street 30 Index
US Wall Street 30 Index is moving towards a support line which it has tested numerous times in the past. We have seen it retrace from this line before, so at this stage it isn’t clear whether it will breach this line or rebound as it did before. If US Wall Street 30 Index continues […]
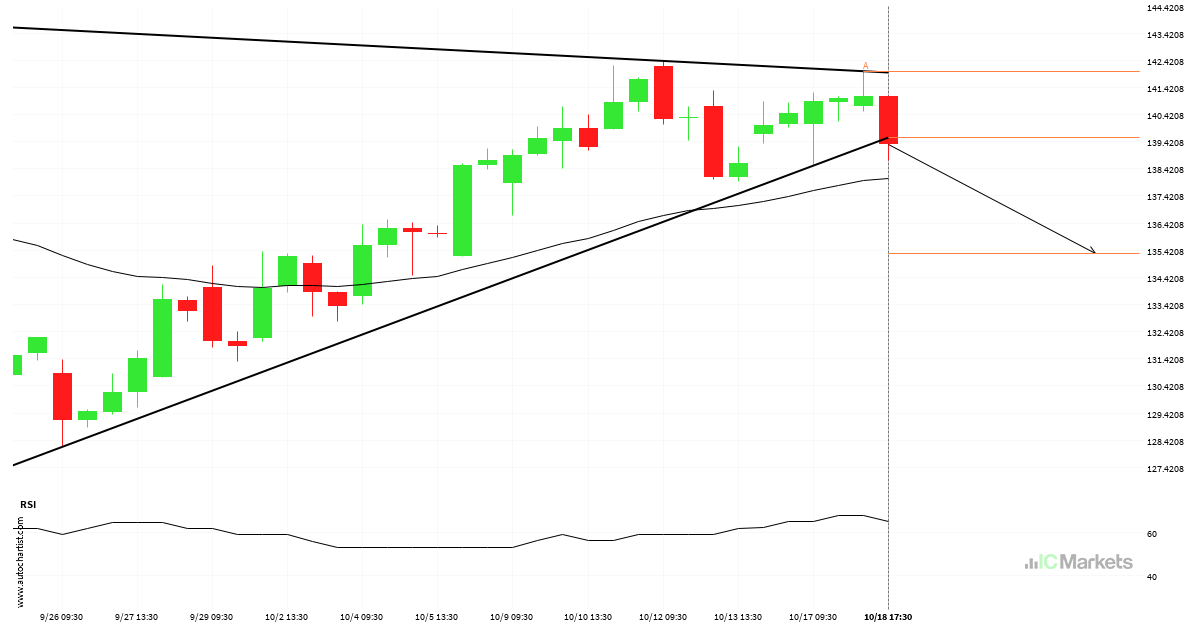
ALPHABET INC CLASS C has broken through support
ALPHABET INC CLASS C has broken through a support line. It has touched this line at least twice in the last 31 days. This breakout may indicate a potential move to 135.3119 within the next 2 days. Because we have seen it retrace from this position in the past, one should wait for confirmation of […]
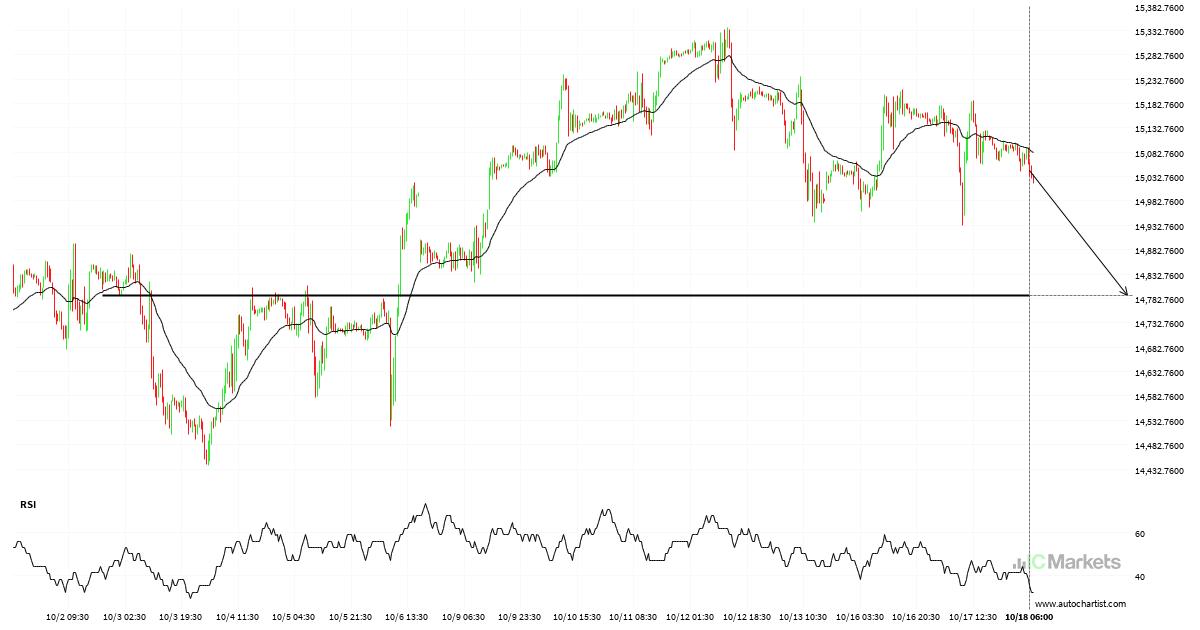
US Tech 100 Index – getting close to psychological price line
US Tech 100 Index is moving towards a support line. Because we have seen it retrace from this level in the past, we could see either a break through this line, or a rebound back to current levels. It has touched this line numerous times in the last 16 days and may test it again […]
What’s going on with US Small Cap 2000 Index?
Those of you that are trend followers are probably eagerly watching US Small Cap 2000 Index to see if its latest 0,68% move continues. If not, the mean-reversion people out there will be delighted with this exceptionally large 18 hours move.
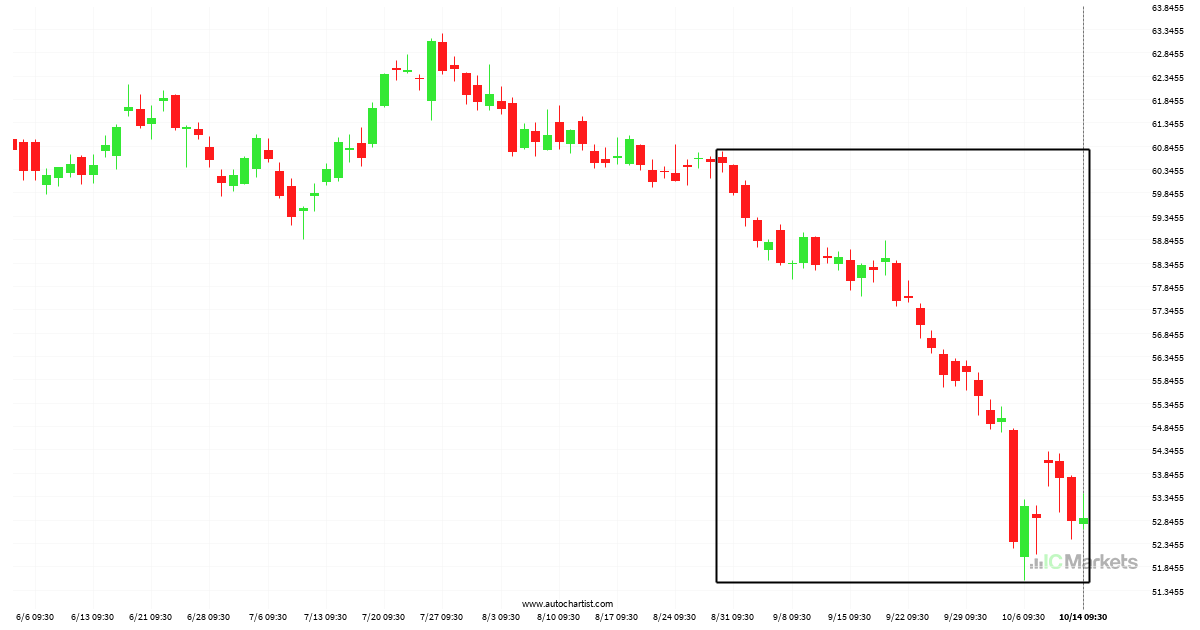
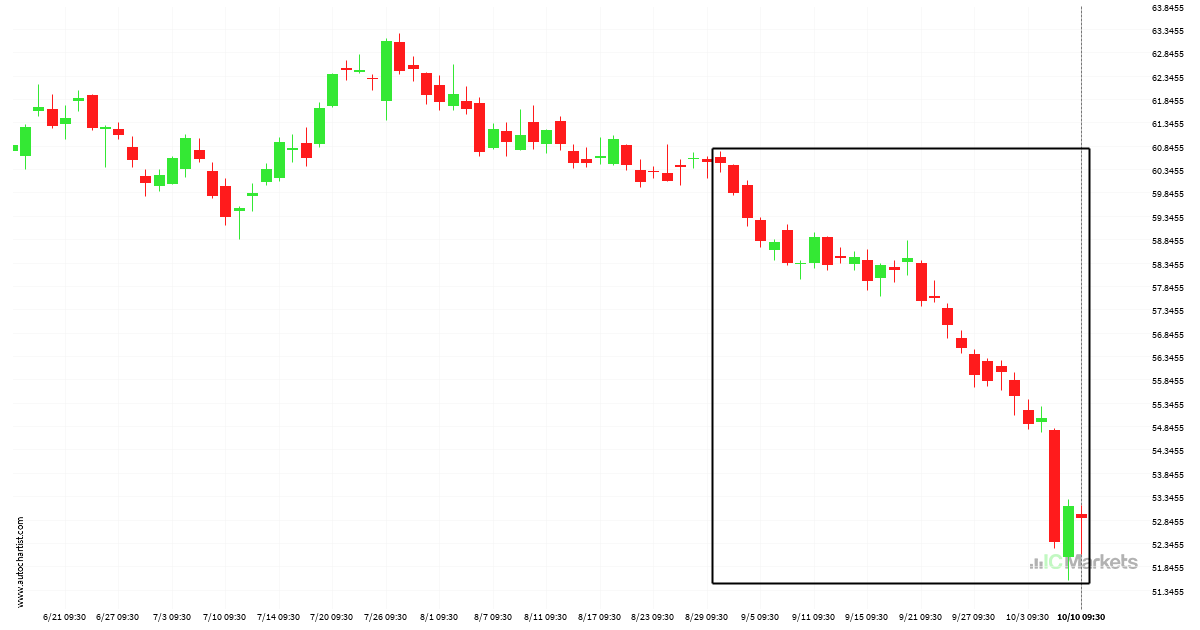
Huge bearish move on Coca-Cola Co.
Coca-Cola Co. has moved lower by 12,56% from 60,485 to 52,89 in the last 46 days.
Possible breach of support level by US Wall Street 30 Index
US Wall Street 30 Index is moving towards a support line which it has tested numerous times in the past. We have seen it retrace from this line before, so at this stage it isn’t clear whether it will breach this line or rebound as it did before. If US Wall Street 30 Index continues […]
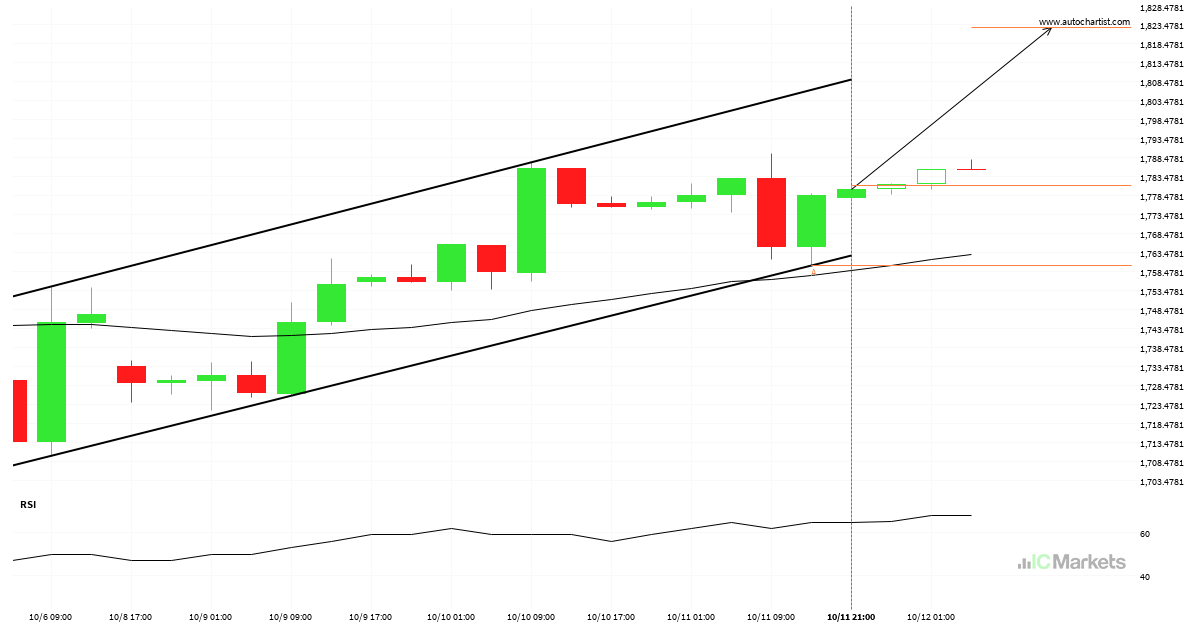
Either a rebound or a breakout imminent on US Small Cap 2000 Index
US Small Cap 2000 Index is heading towards the resistance line of a Canal ascendente. If this movement continues, the price of US Small Cap 2000 Index could test 1822.7225 within the next 13 hours. It has tested this line numerous times in the past, so this movement could be short-lived and end up rebounding […]
What’s going on with Coca-Cola Co.?
Those of you that are trend followers are probably eagerly watching Coca-Cola Co. to see if its latest 12,57% move continues. If not, the mean-reversion people out there will be delighted with this exceptionally large 42 days move.